Practical Guideline: How to Start Calculating Your Product’s Carbon Footprint
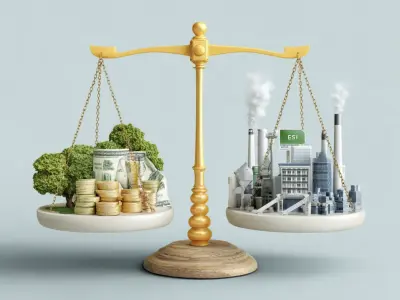
For manufacturers, sustainability has moved from a corporate social responsibility exercise to a strategic business necessity. Regulatory frameworks such as the EU’s CBAM, India’s BRSR now require companies to provide transparent carbon data. At the same time, customers and investors expect credible, auditable disclosures.
Yet for many, the first hurdle is simply knowing where to begin. This article provides a practical, step-by-step guide for corporate leaders in the manufacturing sector who want to start calculating their product’s carbon footprint (CFP). By following these steps, companies can build a foundation for credible measurement, meaningful reduction, and long-term competitiveness.
1. Define the Scope and Boundaries of Your Product
The first and most critical step is to define what exactly you are measuring. Without a clear scope, results may be inconsistent or irrelevant for stakeholders. Key considerations include:
- Product selection: Will you calculate for a single product, an entire line, or multiple categories?
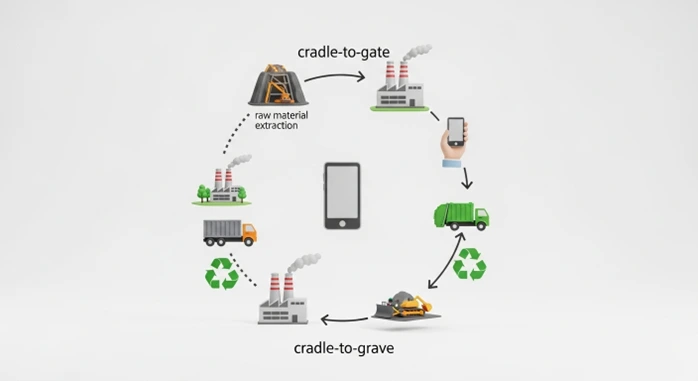
- Life cycle stages: Will you assess only direct operations (cradle-to-gate) or the full life cycle from raw materials to end-of-life (cradle-to-grave)?
- Geographic boundaries: Will you cover global operations, or focus on specific markets?
Aligning with international standards such as the GHG Protocol Product Standard and ISO 14067 ensures global comparability and regulatory compliance.
2. Gather the Right Data Sources
Once boundaries are set, the next step is to identify and collect relevant data. Companies often overestimate the complexity here; much of the necessary data already exists in operational records.
The most common categories include:
- Energy consumption: Electricity, fuel, heating/cooling inputs.
- Materials and inputs: Volumes and types of raw materials, typically from bills of materials or supplier declarations.
- Logistics and transport: Distance, mode, and frequency of distribution and supply shipments.
- Waste and by-products: Scraps, rejects, and disposal practices.
Practical tip: Start with public emission factors and readily available data. Over time, replace with primary data from key suppliers. This staged approach improves accuracy without delaying action.
3. Select a Calculation Method or Tool
The challenge now is to convert activity data into carbon emissions. Choosing the right tool depends on scale, resources, and intended audience. Options include:
- Spreadsheets: Transparent and low-cost, but resource-intensive on a scale.
- Databases and emission factors: Leverage sources such as IPCC or national inventories to convert activity into carbon values.
- Digital platforms: Cloud-based CFP calculators or ESG software integrate data collection, automate calculations, and facilitate reporting.
When selecting tools, consider:
- Auditability (investors and regulators may require verification).
- Integration (ERP, supply chain, MES systems).
- Scalability (ability to expand across product lines or geographies).
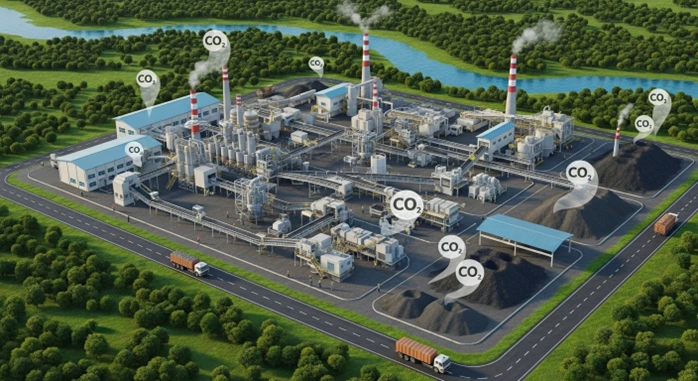
4. Identify Hotspots and Prioritize Action
The first set of results will not be perfect, but it will reveal emission hotspots—the areas with the greatest reduction potential. Typical hotspots in manufacturing include:
- Raw materials: Steel, aluminum, plastics often account for >50% of product CFP in sectors like automotive or electronics.
- Energy in operations: Outdated equipment or inefficient production lines drive emissions.
- Logistics: Air freight can emit up to 50x more CO₂ per ton-km than sea freight.
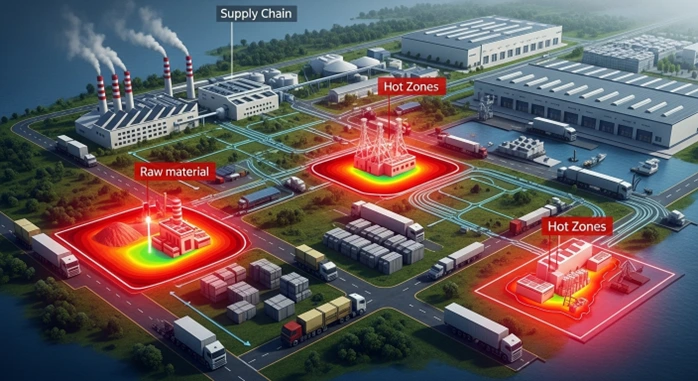
By targeting hotspots, companies can implement initiatives such as energy efficiency projects, material substitutions, or logistics optimization. Importantly, many hotspots lie in the supply chain (Scope 3), not within direct operations.
5. Communicate and Align with Stakeholders
CFP is not just an internal accounting exercise—it is a trust-building tool.
- Customers and OEMs: Increasingly require supplier carbon data as part of procurement.
- Investors and lenders: Expect auditable disclosures aligned with ESG frameworks.
- Employees: Need clarity on how daily actions contribute to sustainability goals.
Transparent reporting—through sustainability reports, ESG disclosures, or supplier portals—helps prevent accusations of greenwashing and enhances credibility.
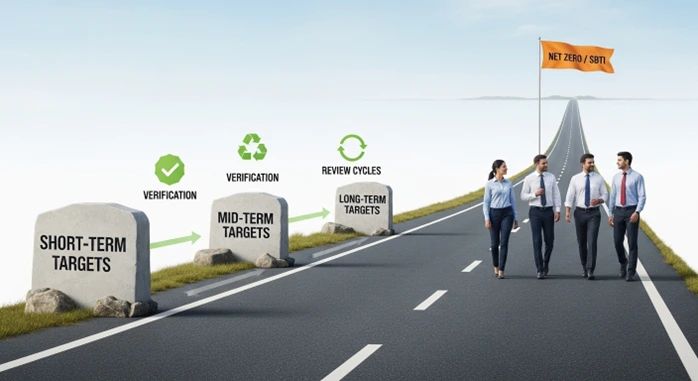
6. Build a Roadmap for Continuous Improvement
CFP calculation is not a one-off task but the foundation of an ongoing journey.
Key roadmap elements include:
- Targets: Short-, mid-, and long-term goals aligned with science-based targets (SBTi).
- Integration: Embed CFP into ERP, supply chain, and product design systems.
- Verification: Consider third-party assurance to strengthen credibility.
- Review and adapt: Reassess boundaries, data, and actions annually to reflect regulation, customer demand, and market shifts.
- Carbon economics: Prepare for carbon pricing, border adjustment mechanisms, and related policies that may affect future costs.
Conclusion
For manufacturing leaders, calculating product carbon footprints is no longer optional. It is the first step to meet regulatory requirements, satisfy customer expectations, and secure long-term financial resilience. By defining scope, collecting data, selecting tools, identifying hotspots, engaging stakeholders, and embedding continuous improvement, companies can move beyond compliance to strategic advantage. Early movers will reduce risks, unlock cost savings, strengthen supplier relationships, and position themselves as leaders in the low-carbon economy.
Explore more
Why Carbon Footprint Management is Becoming a Business Imperative
Manufacturers are at the forefront of the global effort to reduce carbon emissions. What was once a voluntary sustainability initiative has evolved into a non-negotiable business requirement. Today, managing carbon emissions is not optional—it is a strategic necessity that directly influences market access, brand equity, and long-term business resilience.

The Basics of Vehicle Digital Inspection: What It Is and How It Works
Discover how digital transformation is revolutionizing vehicle inspection processes, improving efficiency, accuracy, and compliance while reducing costs and environmental impact.

How Carbon Footprint Management Drives Corporate Financial Performance
How Carbon Footprint Management Drives Corporate Financial Performance